It's that time of year when people start considering new year’s resolutions, as well as thinking about what 2018 will have in store for their organisation. Towards the end of 2017, I had a series of discussions with customers to help them uncover analytic opportunities that will support them in achieving better business outcomes in the new year.
To get ideas flowing, I asked participants to think about the role analytics can play in achieving better business outcomes, and then categorise them across two areas: untapped data and analytic capabilities.
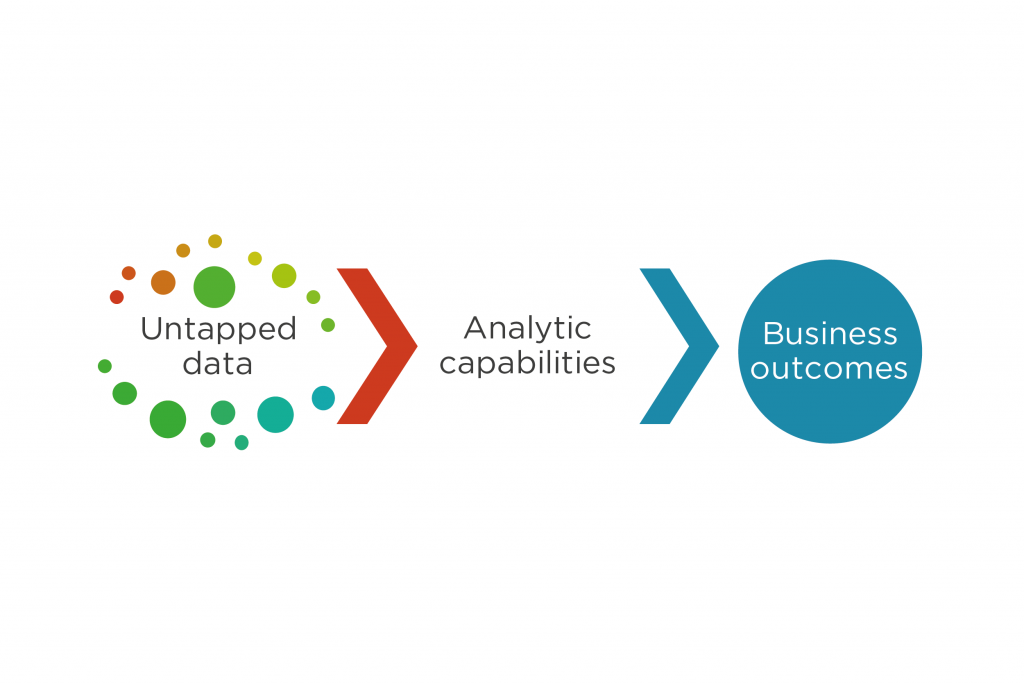
 The simple diagram above is one that I use to both guide the conversation and to capture the ideas generated. I start by framing the discussion from right to left. Business outcomes are achieved when the organisation takes action based on insights generated by analytics. The ability to generate insights is constrained by analytic capabilities and the data you have available. Thus, if we identify the combination of untapped data and analytic capabilities, we will be able to generate value-added insights for the organisation.
Untapped data
Untapped data could include existing data already collected and curated, such as in a data warehouse. It could also mean newer data sources. Perhaps they have landed in a data lake, and are available, but have never been utilised for analysis. For example, a recent published case study explores a retailer’s use of a transactional log data set that resided in Hadoop but had yet to be utilised. The data was used to gain deeper insights into the online shopping habits of customers, which led to improved sales.
Another source of untapped data is the free-form comments captured in many operational systems. Free-form text can be analysed to identify common words or phrases from notes or documents, leading to a better understanding of customer sentiment. Another case study explores utilising free-form text to provide insights; ranging from improving user experiences to identifying product safety issues.
Analytic Capabilities
Analytic capabilities capture both “what do we want to do?” and “how do we do it?” Both of the previous case studies mentioned cover off these topics and a summary is captured in the following table:
.png)
The case studies also go into the specific analytic modelling that was utilised. For example, the hidden-state analysis utilised the Hidden Markov Model (HMMs) to understand likely sequences of events for customers, and the probability of a customer following a particular sequence. HMMs are models of transactional processes in which the true hidden states that generate observable data are probabilistically determined.
My discussions do not get into the specific analytic models required; I leave those up to the data scientists. We often find that multiple models are utilised to determine which one works best, given the data available.
In many ways, these discussions are the prequel to the topic I covered in my last blog, where I discussed identifying analytic use cases and drilling down to the key business questions that could be answered by the analytics.
Do you have a vision for where analytics can take your organisation in 2018? Maybe it’s time to set a few (analytic) resolutions by uncovering the analytic opportunities in your organisation.
As a Senior Business Consultant, Monica’s role is to help organizations answer key business questions through analytics. That is, to utilize her diverse experience across multiple industries to understand client's business and to identify opportunities to leverage analytics to achieve high-impact business outcomes.
With over 35 years of experience, Monica has been leading analytic solutions implementations for 23 years. Prior to joining Teradata, Monica was the Managing Partner of Formation Data Pty Ltd, a Specialty data management, data warehousing and analytics consultancy in Australia.
View all posts by Monica Woolmer